My Blog
Project Part II
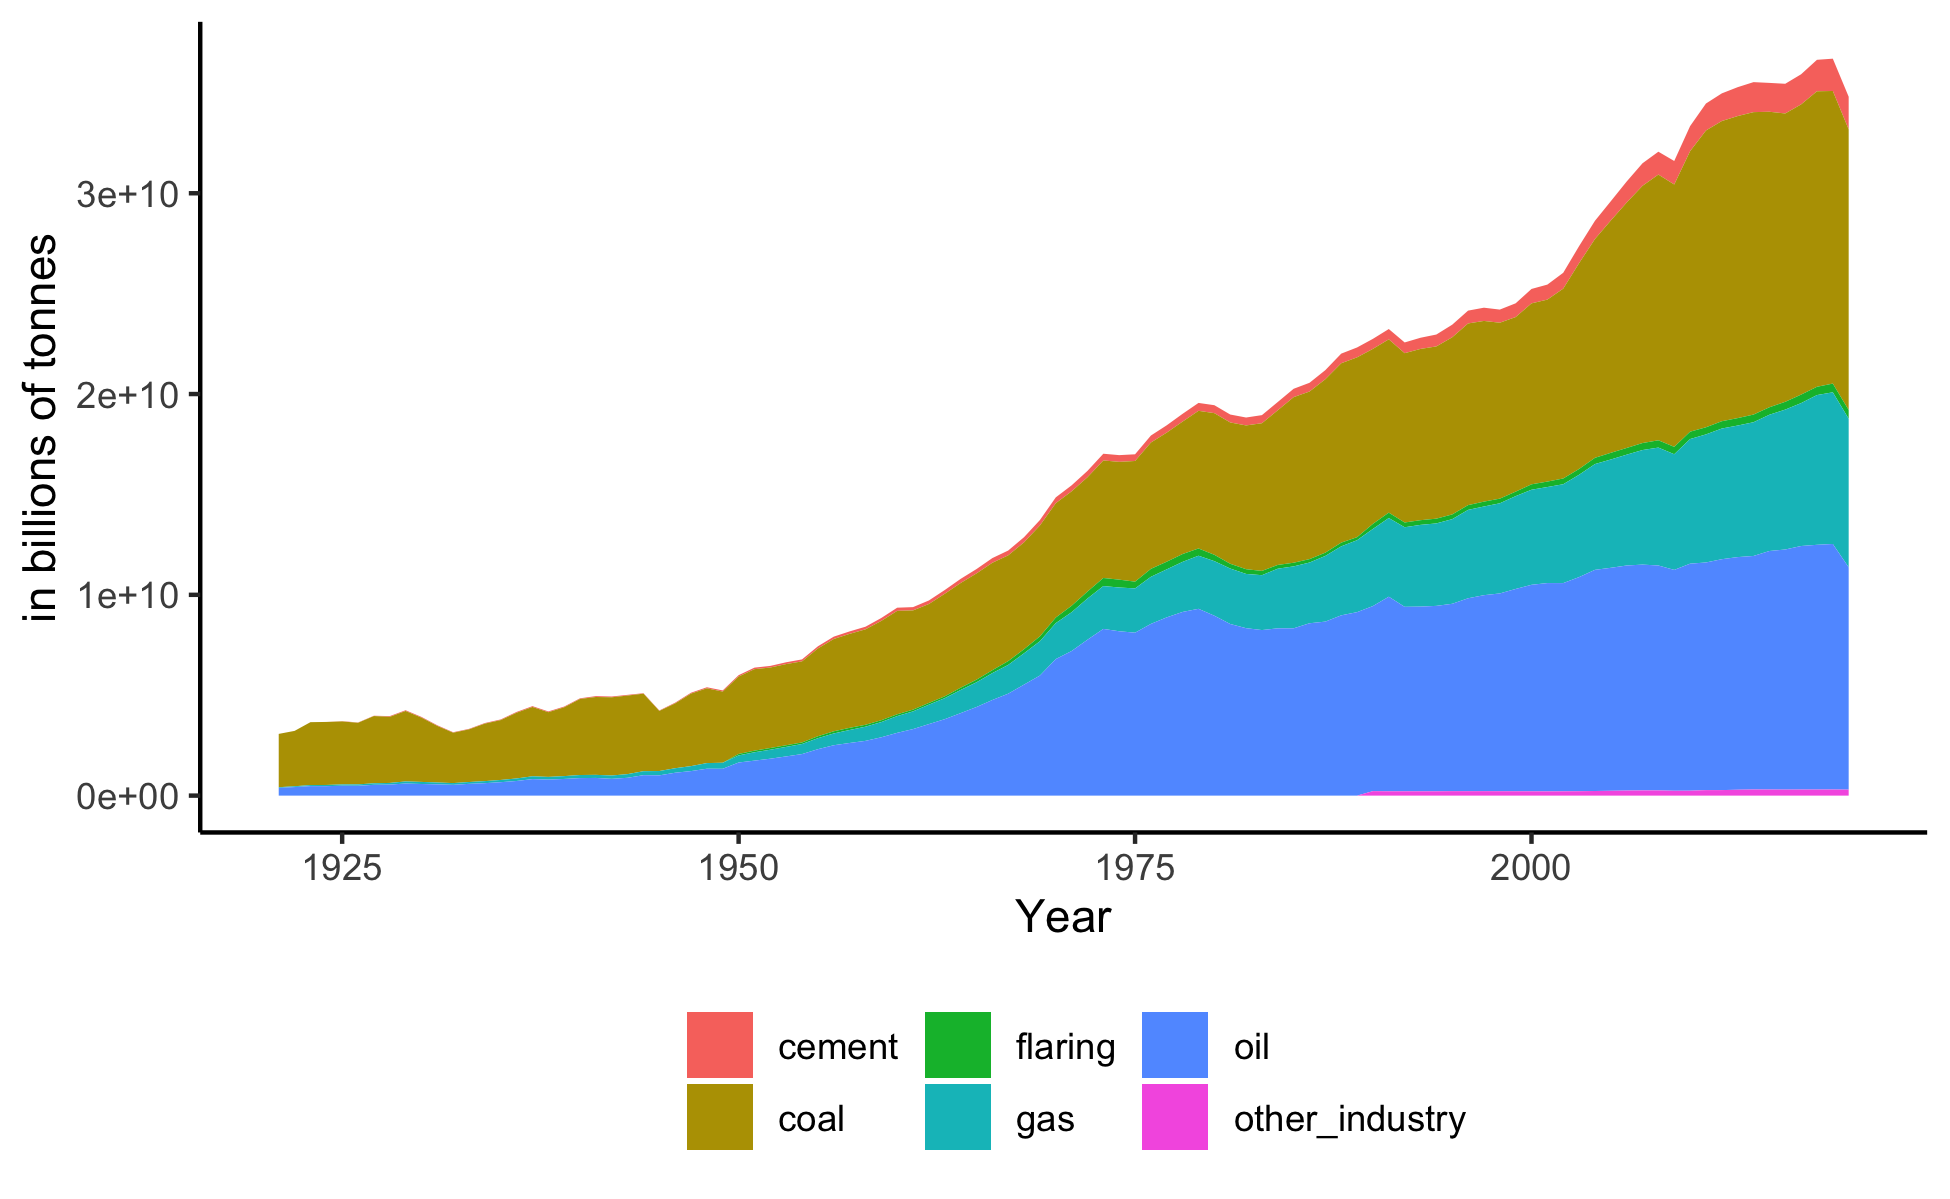
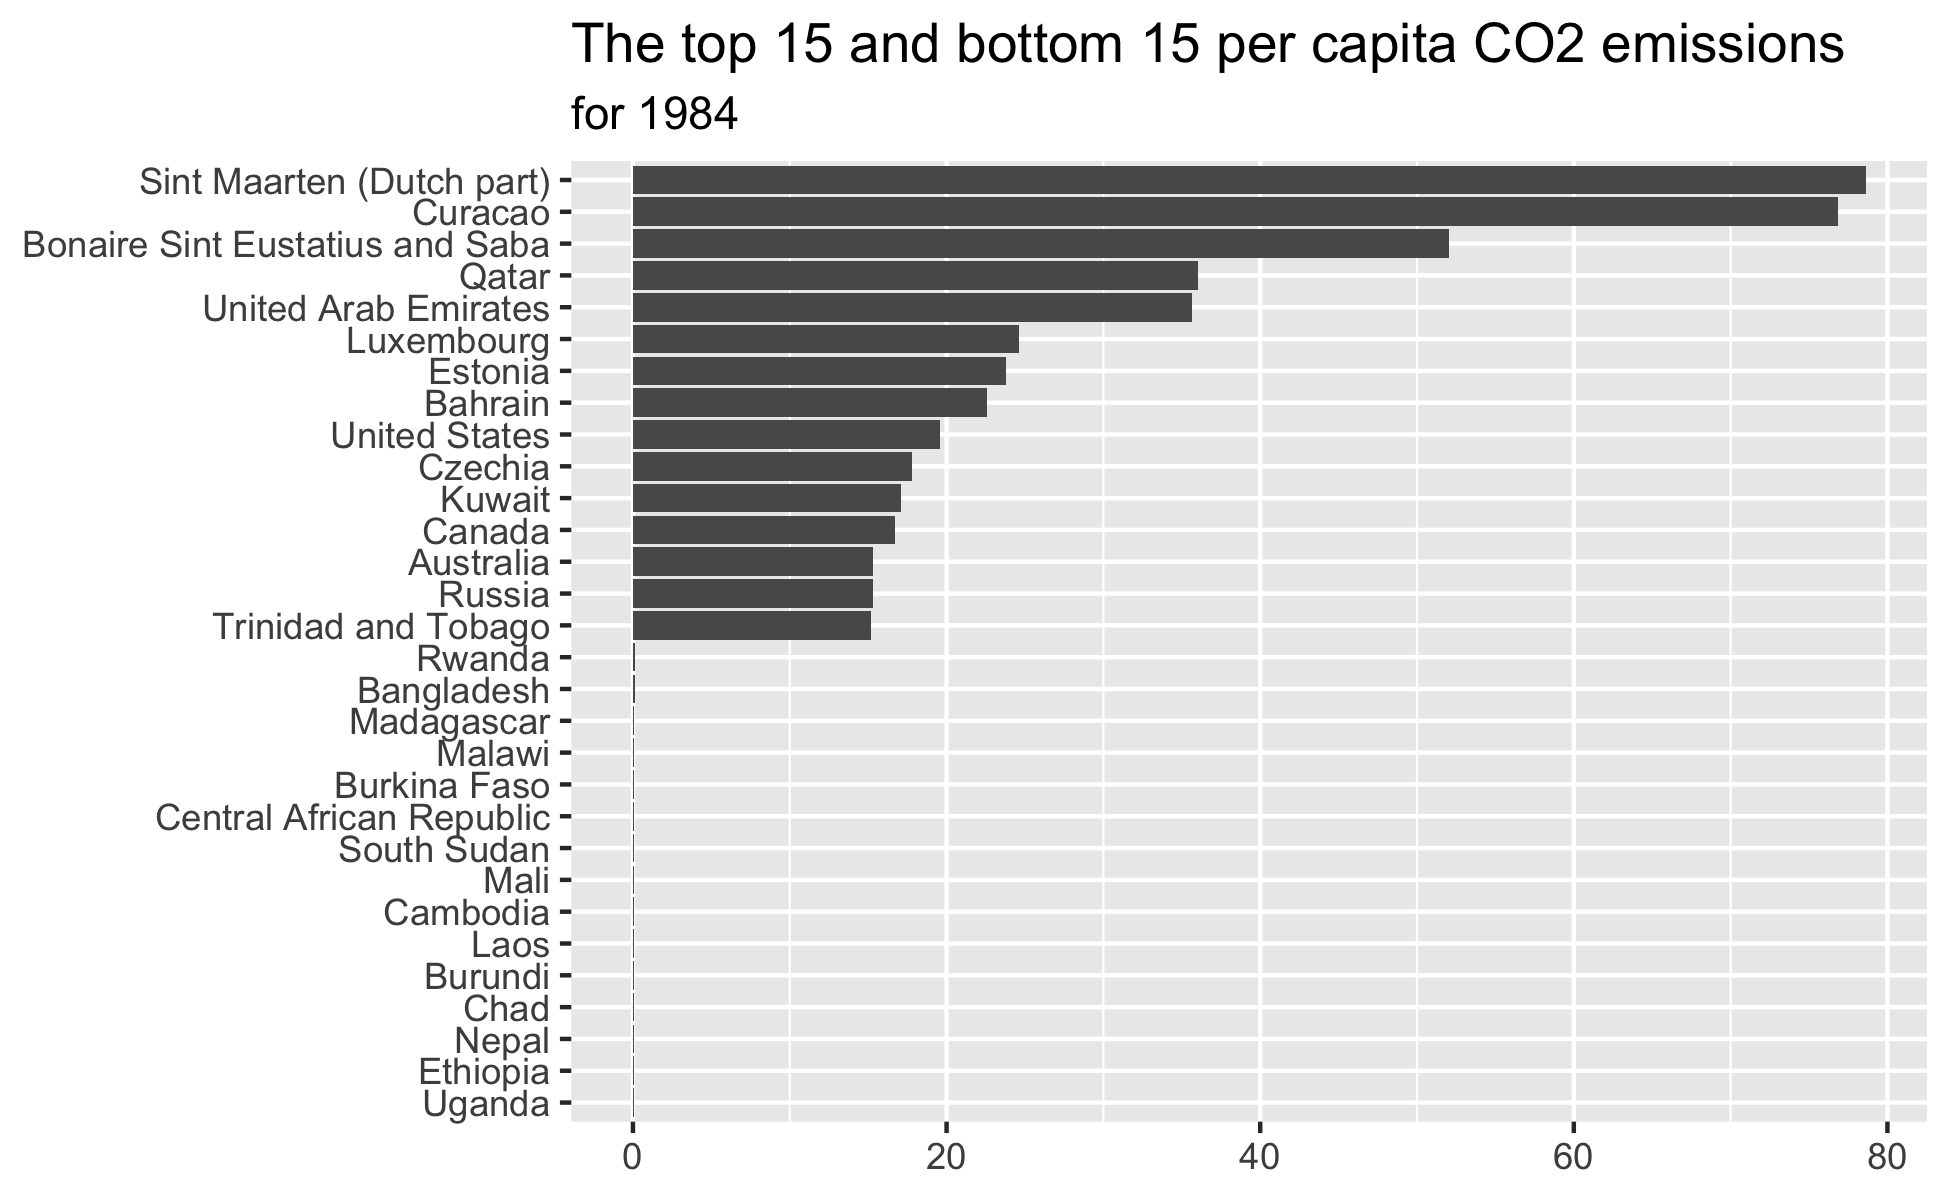
Interactive and static data plots of source type CO2 emissions from 1920 to 2000.
Project - Part I
Humans contribution to CO2 emmisions since 1750s and the type of sources we have been accessible to.
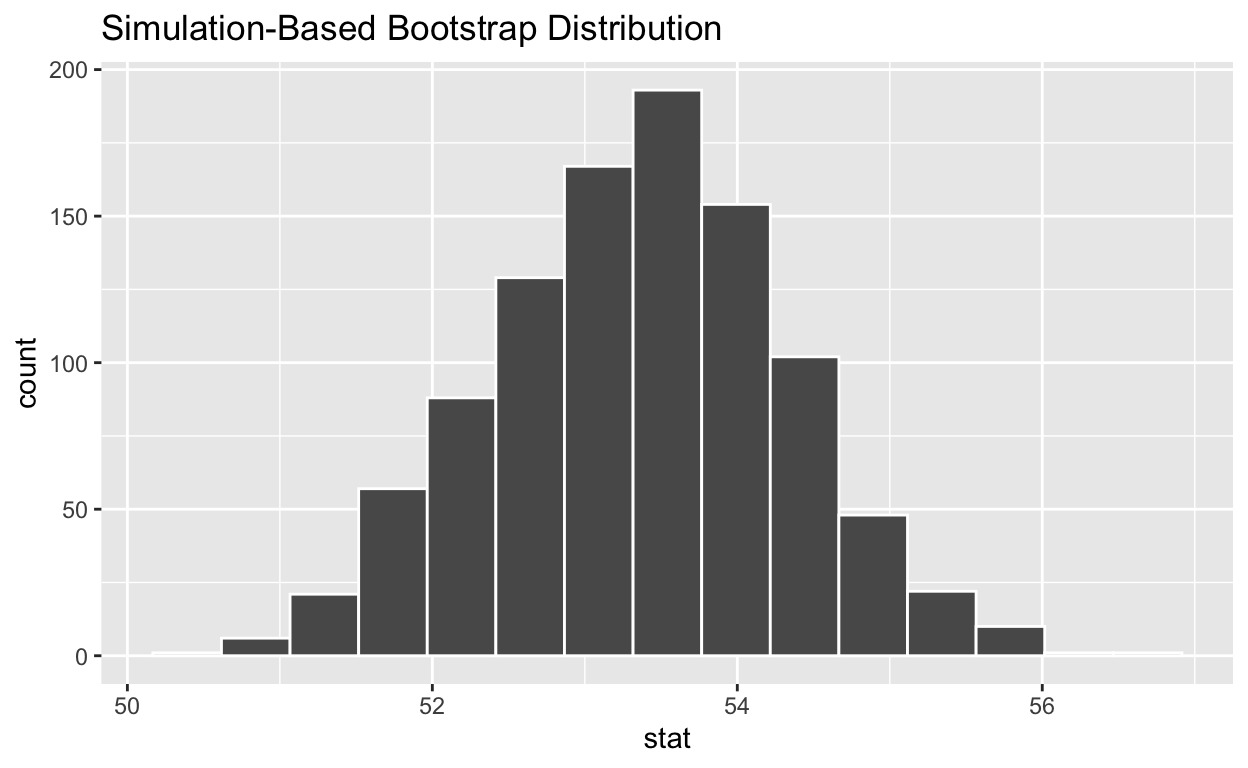
Bootstrapping
Based on Chapter 8 of ModernDive. Code for Quiz 12.
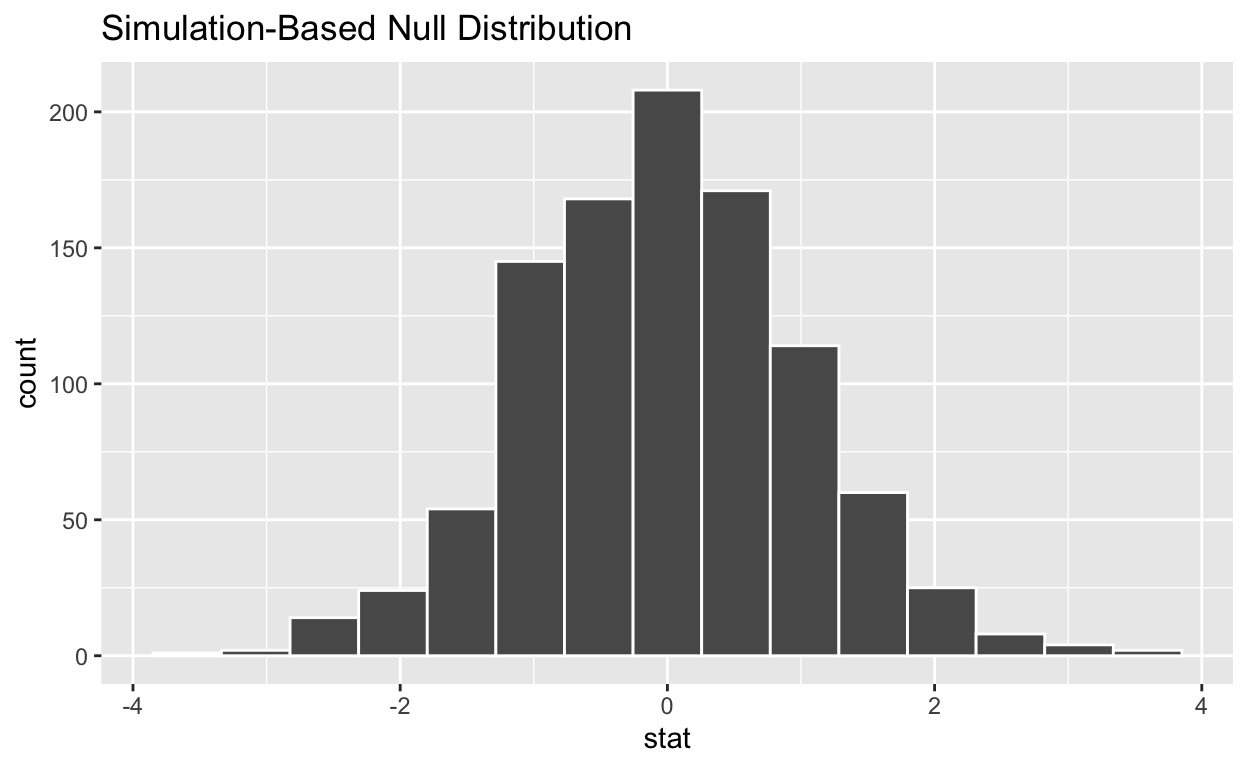
Hypothesis Testing
Using computer simulation. Based on examples from the infer package. Code for Quiz 13.
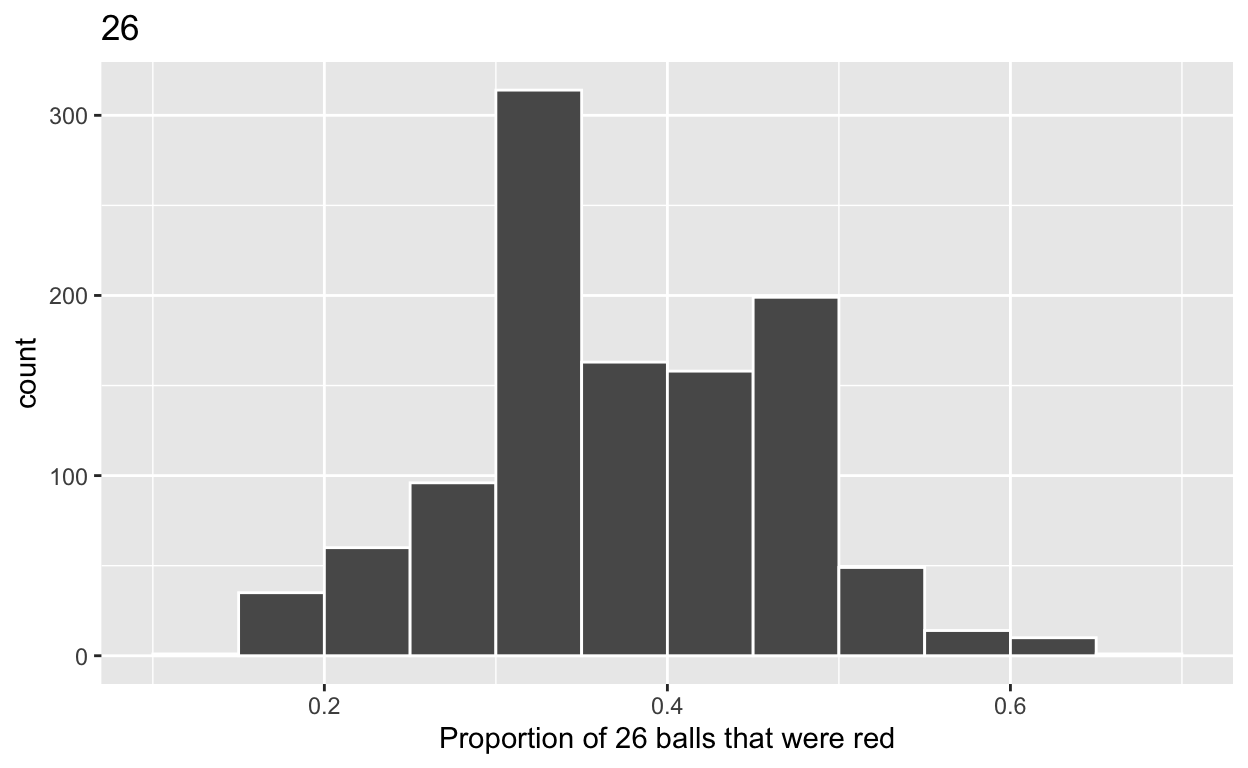
Sampling
Code for Quiz 11. Based on Chapter 7 from ModernDive.
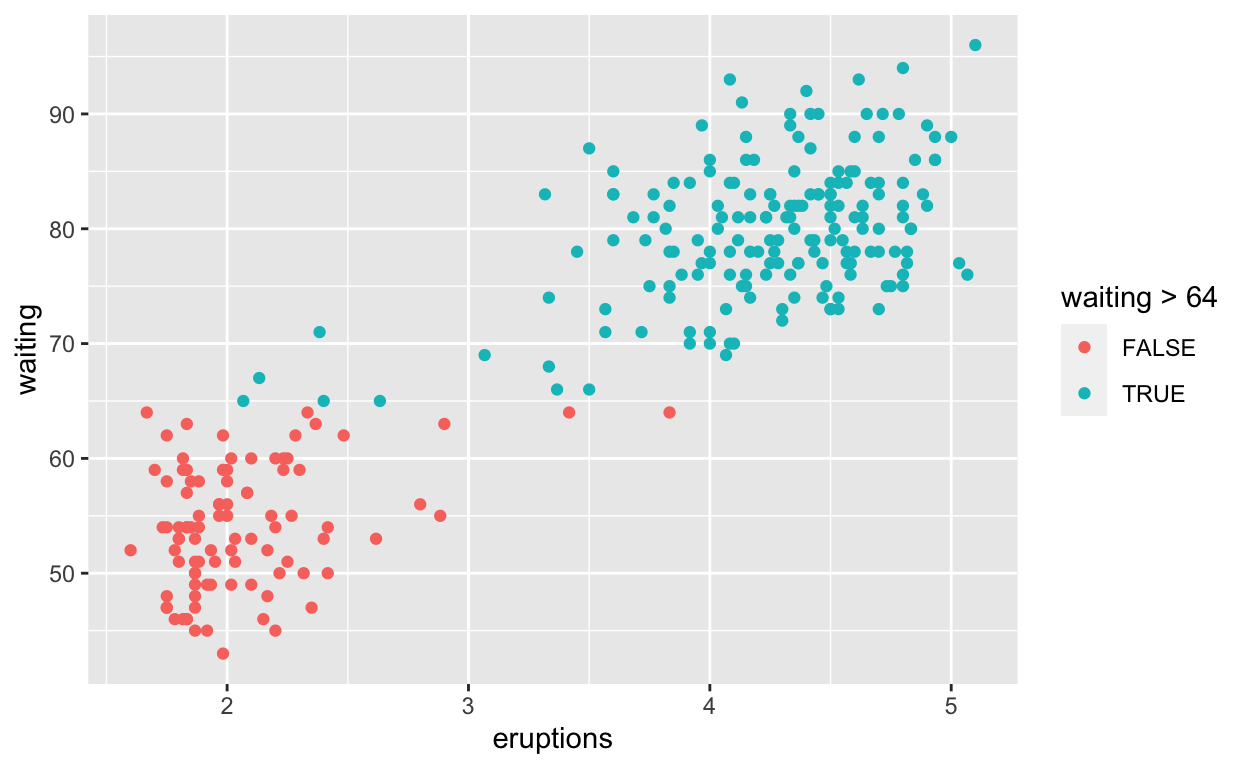
Exploratory Analysis
Data Visualization for Quiz 7, part 1.
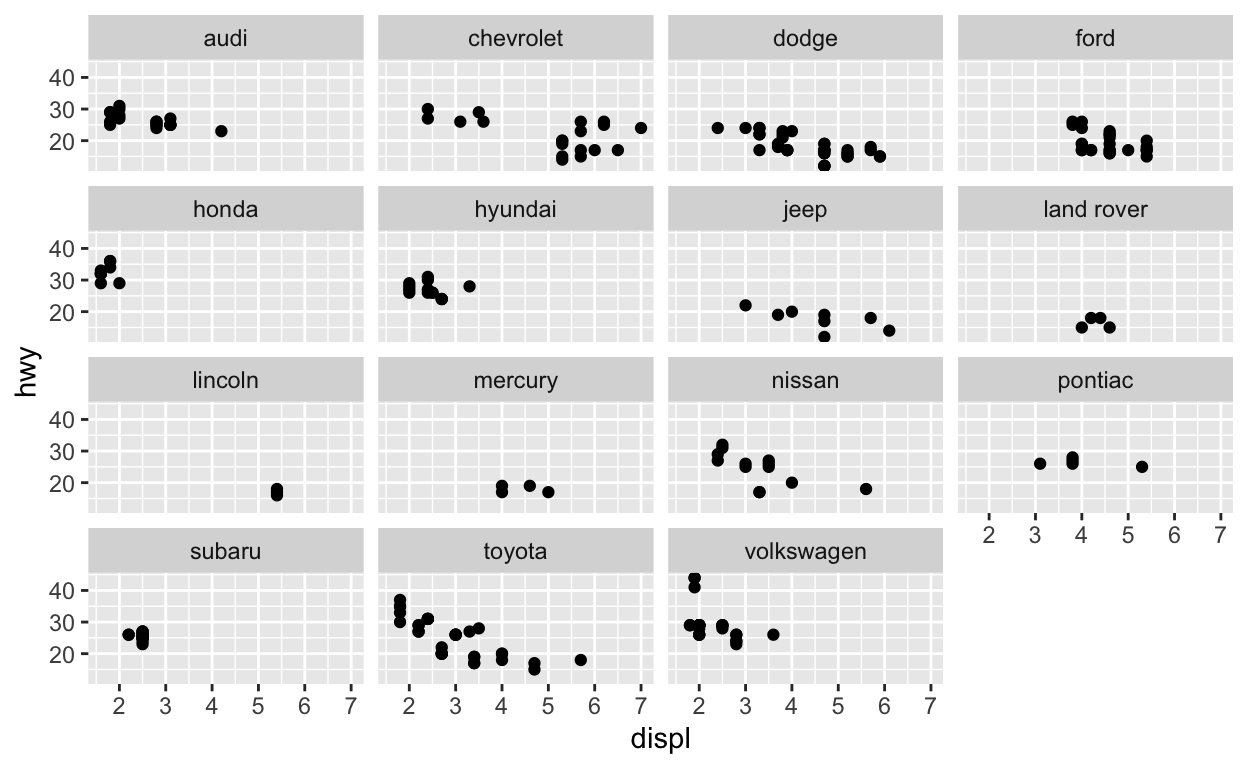
Exploratory Analysis II
Data Visualization - part 2, Code for Quiz 8.
Joining Data
Code for Quiz 6 - more dplyr and our first interactive chart.
Data Manipulation
Code for Quiz 5. More practice with dyplr functions.
Reading and Writing Data
A short description of the post.
Introduction to Dplyr
Code and text for Quiz 3.
Summary Statistics
Comparison of R and Excel