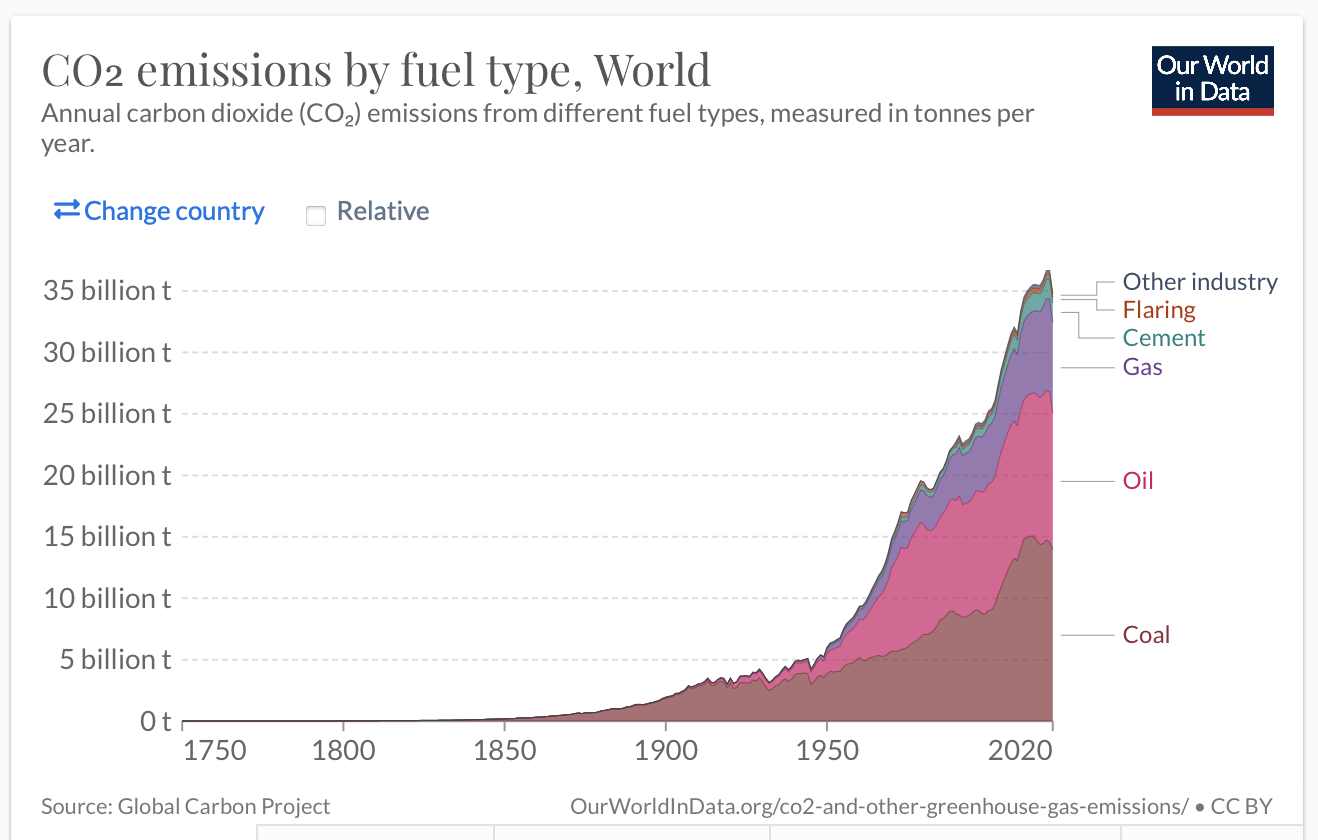
I chose this data to show how over the course of really only the last 100 years and how humans and our access to sources has extensively changed and contirbuted to most of the CO2 Emissions all over the globe.
I downloaded CO2 Emissions By Source (Fuel Type) data from Our World in Data. I selected this data due to my interest in how we as humans contribute to the world and our resources from 1750-2020.
This is the link to the data I have selected for my project.
The following code chunk loads the package I will use to read in and prepare the data for my analysis.
- Read in the data:
- Use glimpse to see the names and types of the columns.
glimpse(co2_by_source)
Rows: 66,937
Columns: 9
$ Entity                                                   <chr> "Af…
$ Code                                                     <chr> "AF…
$ Year                                                     <dbl> 175…
$ `Annual CO2 emissions from coal (zero filled)`           <dbl> 0, …
$ `Annual CO2 emissions from gas (zero filled)`            <dbl> 0, …
$ `Annual CO2 emissions from cement (zero filled)`         <dbl> 0, …
$ `Annual CO2 emissions from flaring (zero filled)`        <dbl> 0, …
$ `Annual CO2 emissions from oil (zero filled)`            <dbl> 0, …
$ `Annual CO2 emissions from other industry (zero filled)` <dbl> 0, …
# View(co2_by_source)
- Use output from glimpse (and View) to prepare the data for analysis
Create the object
sourcethat is list of source I want to extract from the datasetChange the name of the 1st column to Source and the 4th column to CO2emissions
Use filter to extract the rows that I want to keep: Year >= 1921 and Source in sources
Select the columns to keep: Source, Year, CO2emissions
Use mutate to convert CO2emissions to billions of tons
Assign output to
source_type_co2Display the first 10 rows of
source_type_co2
source_type_co2 <- co2_by_source %>%
filter(Year >= 1921, Entity == "World") %>%
  rename(coal = 4, gas = 5, cement = 6, flaring = 7, oil = 8, other_industry = 9) %>%
  select(Year,4:9)

source_type_co2
# A tibble: 100 × 7
    Year       coal       gas   cement flaring      oil other_industry
   <dbl>      <dbl>     <dbl>    <dbl>   <dbl>    <dbl>          <dbl>
 1  1921 2654960471  34992067   129526       0   3.84e8              0
 2  1922 2757366894  40106756   192706       0   4.26e8              0
 3  1923 3132092617  52525941   207881       0   4.74e8              0
 4  1924 3138926125  59707555   215951       0   4.71e8              0
 5  1925 3138718829  63920274 14341240       0   4.93e8              0
 6  1926 3067699555  69142085 14651099       0   4.91e8              0
 7  1927 3349258707  76014443 15355300       0   5.38e8              0
 8  1928 3291869503  82620625 35521484       0   5.50e8              0
 9  1929 3509775811 102891182 36780462       0   6.03e8              0
10  1930 3202446125 104220017 35473151       0   5.79e8              0
# … with 90 more rows
Check that the total for 1921 equals the total in the graph
# A tibble: 1 × 1
      total_emm
          <dbl>
1 1591934380436
Add a picture.
Write the data to file in project directory.
write_csv(source_type_co2, file="source_type_co2.csv")